Daily, per site
Know what normal looks like at your site, and see the day it changes.
Daily very-high-resolution imagery of a named site builds a pattern-of-life baseline. Each new pass is checked against it, and departures come to you as dated flags.
- GSD
- ≤0.5 m VHR
- Cadence
- daily, cloud permitting
- Platform
- VHR satellite or aerial
- Spectral
- RGB
- Baseline
- Daily observation
- Collection gap
- Flag
01
What "normal" costs you at every handover
You own a site on the watch list. Every morning a new pass lands in the queue next to the passes for your other sites, and the routine is the same. Open the latest frame, pull up the previous one, flip between them, and try to remember what the yard looked like the week before that.
Change detection between two frames shows a truck at the gate that wasn't there yesterday. It doesn't tell you whether a truck is there every Tuesday. Normal for the site lives in your head, in a run of exploitation notes, and in whatever the last analyst wrote in the handover.
When you rotate off or go on leave, the next person inherits the imagery but not the sense of it. They spend their first stretch on the site relearning what a routine day looks like. Anomalies get lost the same way: buried in routine review, or spotted late because nobody could say the change was new.
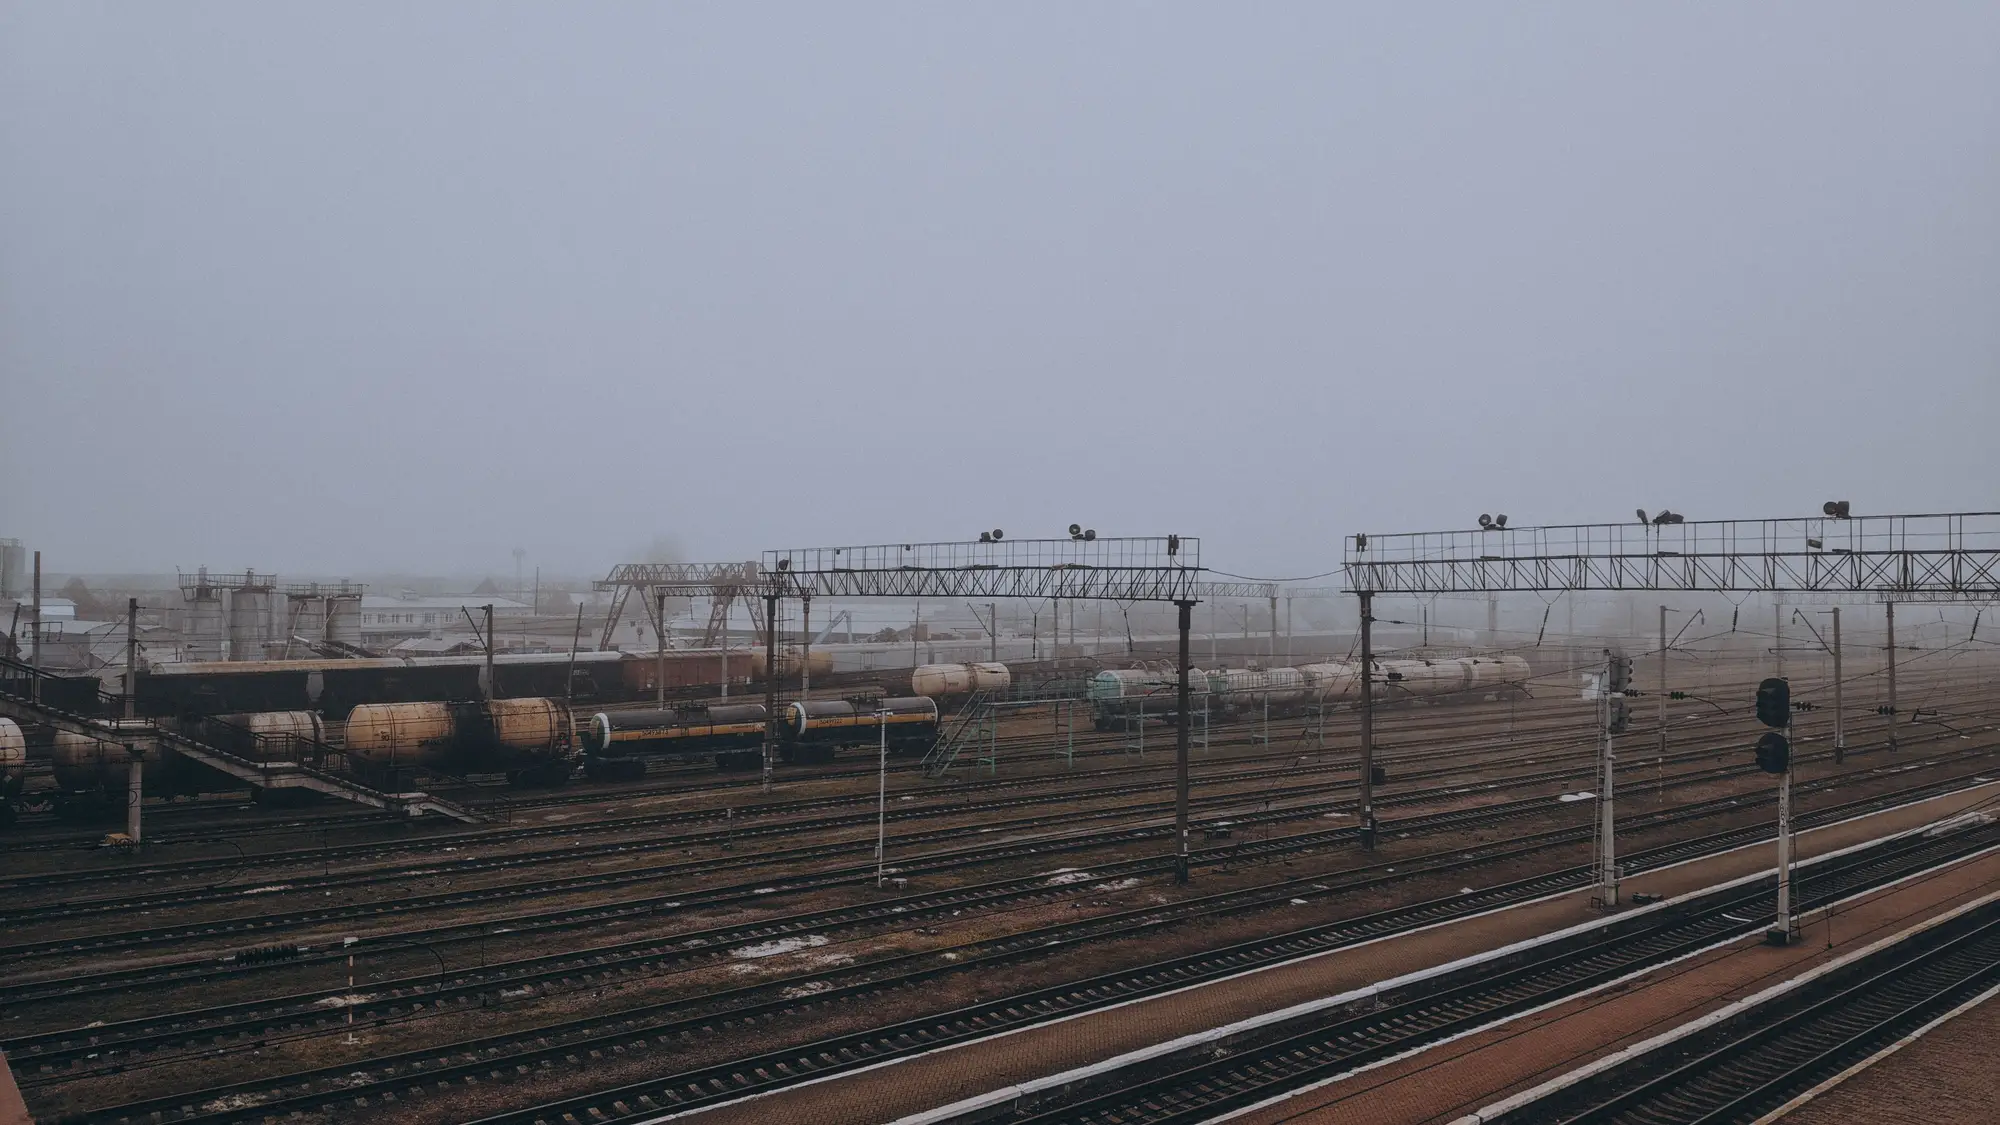
Activity-Based Intel keeps the running record for you. Each daily pass is logged against the site's baseline, so what comes forward is the departure, and the baseline stays behind as a reference for whoever picks the site up next.
02
What arrives for the site
2.1Standing reference
Site activity baseline
The accumulated normal-pattern profile for the site, built up from daily observations. It is updated as passes come in, and it is the thing each new pass is measured against. It also serves as the reference you hand to the next analyst at shift change.
2.2Daily bulletin
Daily observation log
One entry per pass: the date, what was seen, and whether the pass fell inside the baseline. A day with no usable pass is logged as a collection gap.
2.3Dated entries
Anomaly flags
A flag records a deviation from the baseline: the date, where at the site, and what differs from the usual pattern. A flag is a prompt to look at the frame, and the judgment on it stays yours.
2.4CSV
Time-series export
The observations for the site as a table, so you can chart them, join them to your own notes or feed them to your team's analysis tools.
03
How it works
Name the site
You give us the site or draw the AOI. One site is the pilot; each site gets its own baseline.
Daily pass
A very-high-resolution pass over the AOI is collected each day the sky allows. Days that cloud out become collection gaps in the log.
Baseline and check
Detection and time-series models turn the passes into an activity baseline, then check each new pass against it. The first stretch of the pilot is the baseline building up, so flags are thin at the start and get more meaningful as the record grows.
Delivery
A daily bulletin, the flagged-anomaly entries and the time-series export, each dated.
04
Where it fits in your work
- Before the daily read.
- Open the bulletin first. If nothing flagged, the site stays in routine review. If something did, you know which frame to open and what the flag is measured against.
- Shift handover.
- The baseline and the flag history go into the handover, so a new analyst reads the site's normal instead of rebuilding it from old notes.
- Ahead of tasking.
- A dated flag gives you a reason and a date when you ask for a deeper look on the site.
05
Limits
These are the places the record can mislead you. Read them before you rely on a flag.
A baseline takes a run of observations
One day is not a baseline. During the pilot's early days the profile is thin, and a flag then means only "different from a short record".
Cloud sets the calendar
Daily is the aim, not a promise for every site. Cloud breaks the run, and a missed day is logged as a collection gap. It is not treated as an anomaly.
Half a metre is the floor
At ≤0.5 m a vehicle is a small cluster of pixels. You can see it is there and roughly how big it is, and you cannot read its model. Nothing inside a building or under canopy shows.
Optical, daytime, RGB only
No night imagery, no infrared, and nothing through cloud. Shadows and sun angle differ between passes and can look like change, so check the frame behind every flag.
An anomaly is a deviation, not a finding
A flag says a pass differs from the site's pattern. It does not say why, and it does not say the difference matters. That call is the analyst's.
It reports, it does not forecast
The service tells you what changed against the baseline. It has no model of what happens next.
06
Who it's for
For
- Imagery and GEOINT analysts who own a named site and read its imagery day after day.
- Team leads who want the baseline to outlast a rotation, so a handover carries the site's normal with it.
- Shops that want the departures pulled out of routine imagery review, with the frame still there to check.
Not for
- Teams that want a threat or intent assessment. This flags deviation from a pattern and stops there.
- Forecasting or prediction of what a site will do next.
- Single-snapshot questions. A one-off image of a site has no baseline to check against.
- Night, all-weather or through-cloud monitoring.
- Vehicle-type or object-level identification below what half a metre resolves.
07
Questions from analysts and their leads
How long until there's a usable baseline?
It needs a run of observations. A single day can't establish what is normal, and the pilot period is when the baseline builds. Flags early in the pilot are measured against a short record and should be read that way.
Is an anomaly the same as a threat?
No. It is a deviation from the established pattern, for analyst judgment. Nothing in the bulletin classifies intent or threat.
What if cloud breaks the daily run?
A missed day is logged as a collection gap. It is not scored as an anomaly, and it doesn't reset the baseline.
Does this predict what happens next?
No. It reports what changed against the baseline. It is not a forecast.
Can it run on more than one site?
Yes. Each site gets its own baseline, log and flags. The pilot starts with one.
How do we check a flag against our own sources?
Every flag carries its date and the frame it came from, so you can lay it beside your own exploitation notes and other reporting for the same day. Validation stays with your analysts.
What goes into our tools?
The time series comes as CSV. Ask in the chat which overlay format your workstation wants for the flags, and a specialist will confirm what can be delivered.
What do we have to send you, and who holds the imagery rights?
You name the site or AOI. Use and ownership terms for the deliverables are written into the contract before the pilot starts, and the imagery sources keep their own licences.
How is it priced?
Each pilot is scoped and quoted on its own: the site, the pilot period and what you want back. You get a written scope you can take through your own procurement.