What is a dwell-time baseline, and why it beats a single headcount
A single vehicle count from one pass tells you almost nothing. A dwell-time baseline shows whether that count is normal for the site.
The headcount trap
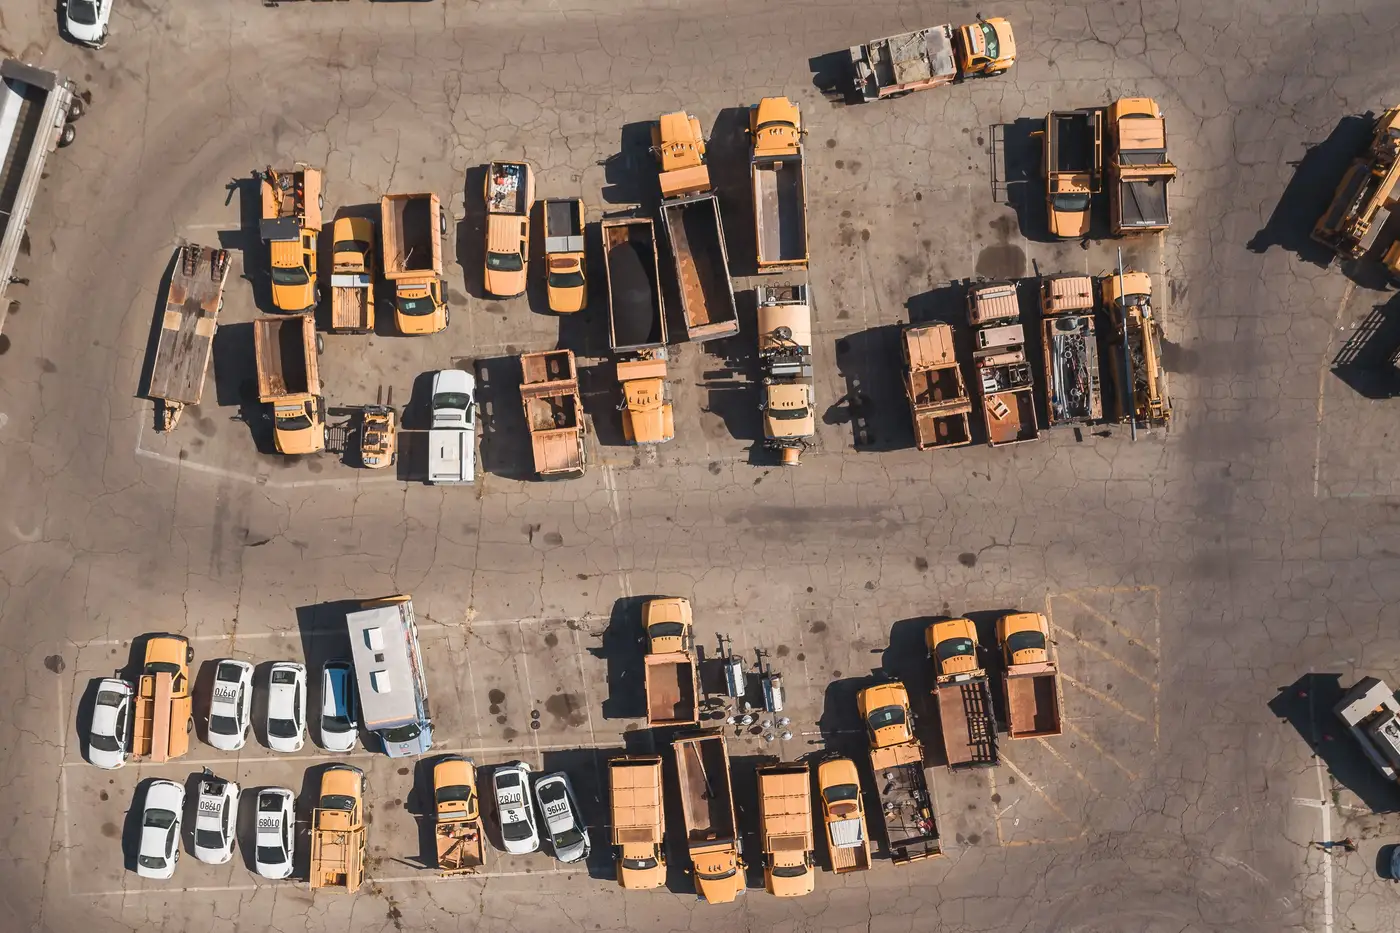
A single pass gives you a number. Fourteen vehicles in the lot. Three trucks at the dock. Six trailers staged behind the warehouse. Analysts like a clean count because it's easy to write down and easy to brief.
A count from one image tells you almost nothing on its own. Fourteen vehicles could be a slow Tuesday, a shift change, or the first visible sign of something building. The pattern behind it is what tells you which.
This is the gap that trips up a lot of routine imagery review. The count goes in the log, it gets compared to last week's count, and if the two numbers are close, the tasking moves on. But vehicles can sit still and still tell you something is different.
What dwell time actually measures
Dwell time is how long a given vehicle, trailer, or piece of equipment stays in the same spot across repeat looks at a site. It measures how long something has been there and whether that duration matches what's typical for the spot. A truck that parks at the dock and leaves within the hour is routine. The same truck sitting in the same bay for three days running is not, even if the headcount that day looks identical to every other day.
A baseline is what you get once you've accumulated enough daily passes to know the difference. Weeks of repeat collection over a named site start to show the ordinary rhythm: how fast the dock usually turns over, which bays sit empty most nights, how long a staging area typically holds equipment before it moves. Once that rhythm is established, a pass that doesn't fit it stands out on its own, instead of getting buried in a stack of imagery that mostly looks the same.
Vehicle dwell time imagery analysis works this way because it leans on repetition, not resolution. The same lot, looked at daily and long enough to establish what normal turnover looks like, is what lets you spot the pass that breaks the pattern.
Headcount vs. dwell-time anomaly
Here's where the two measures pull apart. A headcount anomaly is a number that's off: more vehicles than usual, or fewer. Easy to flag, easy to explain in a report.
A dwell-time anomaly is subtler. The count can stay flat while the behavior underneath it changes entirely. Same fourteen vehicles, but this week they're staying three times as long as the baseline says they should. Same six trailers, but turnover at the loading bay has slowed to half its usual rate.
A headcount check alone would call that site unremarkable. A dwell-time baseline flags it the same day because the pattern carries the signal.
This matters most at sites where the activity itself is the signal. A staging yard, a maintenance depot, a dispersal area: the inventory count there is secondary to what the vehicles are doing. At any one of those, the vehicle total can hold steady for weeks while the turnover pattern underneath shifts. That kind of shift only shows up when today's pass is checked against the site's own baseline, built from repeat daily looks over time.
Why this belongs in daily tasking, not a one-off tip
A baseline isn't something you build from a handful of looks. It takes a run of daily VHR collection over the named site before "normal" means anything statistically useful, and it has to keep running so the baseline stays current as the site's own rhythm shifts with season or tempo. Checking each new pass against the pattern a site has already shown is a different exercise than comparing two snapshots side by side, and it catches a different class of change.
If your review process is still counting vehicles pass to pass, you're seeing the count. Activity-Based Intel builds the baseline underneath it and flags the day the pattern breaks.