Activity tempo: what counts as normal at a site, and when it shifts
A plain-language look at activity tempo, why it defines a site's normal baseline, and how to tell a real tempo shift from routine noise.
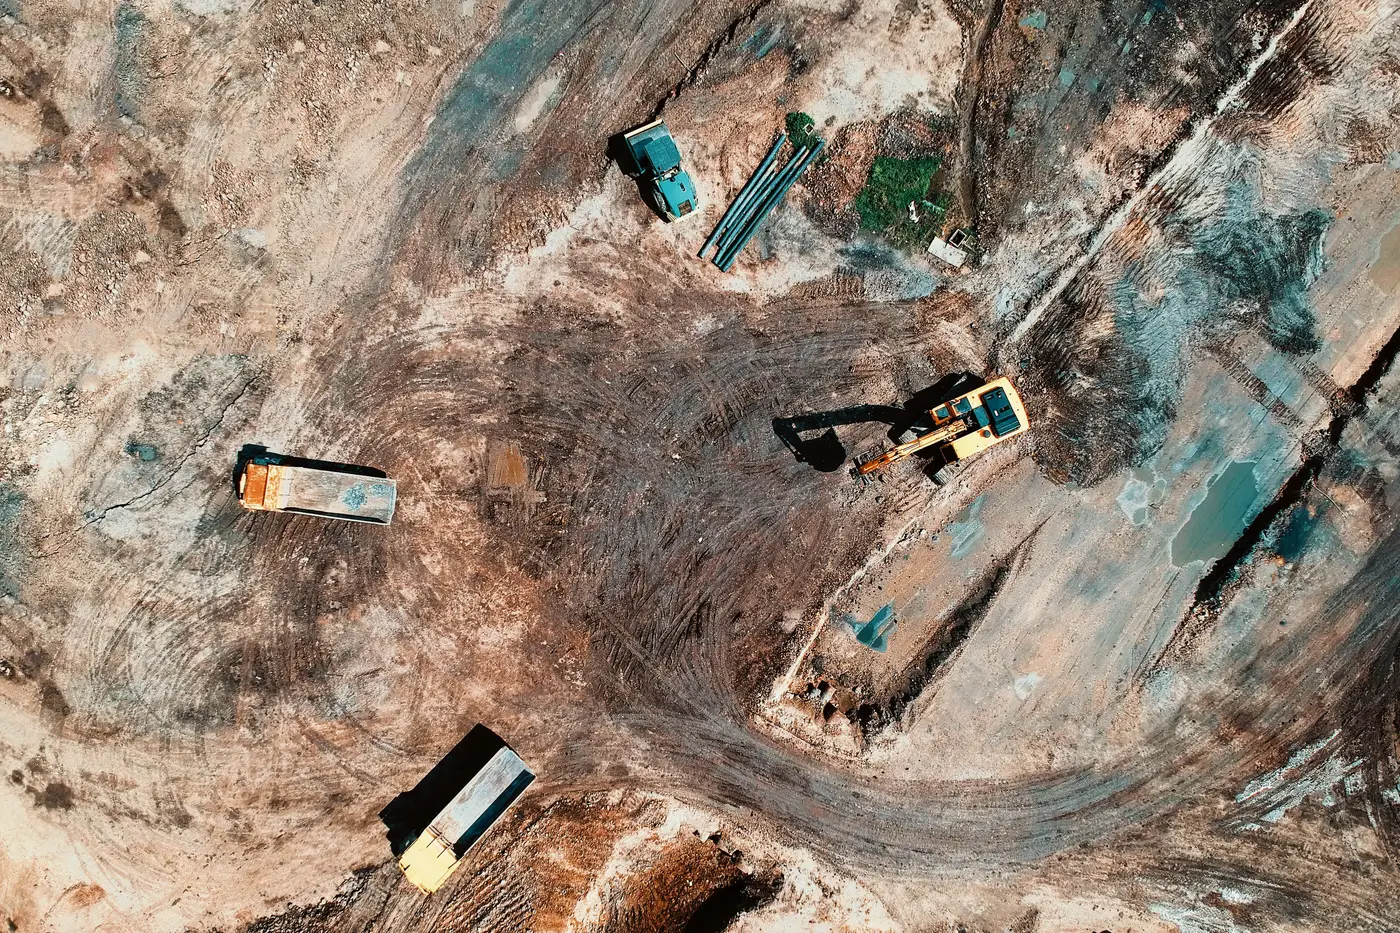
Tempo is the rate at which things happen at a site. It sits apart from the things themselves. A loading dock that moves six trucks a day has a tempo. A construction pad that adds two pieces of equipment a week has a tempo. The vehicles parked, the stacked material, the vegetation disturbance: that's the activity. Tempo is how fast that activity accumulates or turns over, and it's the part of pattern-of-life work that single-image review tends to miss entirely.
An analyst looking at one pass can count trucks, measure a footprint, flag a new structure. None of that tells you whether the site is speeding up, slowing down, or running exactly as it has for the last six months. You need the sequence for that, not the frame.
What activity tempo actually measures
Tempo shows up in a handful of countable things: how often a given area changes state, how long material sits before it moves, how many new vehicle signatures appear week over week, how regularly a gate opens and closes if you're reading it off shadow and surface wear rather than the gate itself. None of these numbers mean much from a single look. They mean something once you have thirty or sixty days of looks to compare against.
A site that adds a stack of containers every Tuesday and clears half of it by Friday has a tempo. So does a site that sits still for three weeks and then turns over its entire yard in four days. Neither pattern is inherently suspicious. The point of tracking tempo is having the second one on record so that when it happens again, or stops happening, you notice.
Tempo shift at a site versus normal variance
A site doesn't have one normal tempo; it has a range, and the range usually has its own rhythm: slower on weekends, faster at month-end, seasonal swings if the activity ties to weather or a harvest or a shipping schedule. Treating every Tuesday spike as an anomaly just because Monday was quiet is how an analyst ends up flagging noise and missing the thing that matters.
A real tempo shift at a site shows up as a sustained change in the baseline across multiple cycles, something day-to-day wobble never produces. Three weeks of double the normal vehicle turnover. A loading pattern that used to run daytime only and now runs overnight as well. A site that went quiet for two months and then came back at a tempo it never had before. These are shifts in the underlying rate, not one-off spikes that regress the next day.
Telling the two apart requires a baseline wide enough to show the normal range, not just an average. If your sample is ten days, a tempo shift and a busy week look identical. If your sample is ninety days, the busy week sits inside the range you've already seen, and the shift stands out because it doesn't.
Setting what counts as normal activity level
Normal is the pattern a site settles into once you've watched it long enough to see it repeat across multiple cycles. That usually means catching at least a few of whatever rhythm the site runs on: weekly for a logistics yard, monthly for a construction phase, seasonal for anything tied to agriculture or weather. Until you've seen the cycle repeat at least once, you don't know if a given week is normal or just the first time you've looked.
This is also why a baseline built from one or two reference images gets thin fast. Reference imagery tells you what the site looked like on a given day. It doesn't tell you the tempo that day sat inside of. A site can look identical in two photos taken a month apart and still have had a completely different rate of change in between: more turnover, more idle time, more overnight movement, whatever the site's version of tempo happens to be.
Building that kind of baseline by hand, stitching daily looks together and tracking the rate of change against what came before, is exactly the kind of repeat-look problem that gets deprioritized when the next tasking request lands on the desk. Activity-Based Intel builds the baseline from accumulated daily passes over a named site and checks each new pass against it, so a tempo shift shows up as a flagged deviation instead of something you catch three reviews later.
If you're trying to pin down what normal looks like for a site you're watching, that's the baseline worth building first.